Our Blog
Stock Market & Option Volatility Report 4-4-19: VIX still squeamish about the S&P 500?
Stock Market & Option Volatility Report 4-3-19: VIX curve steepens
Stock Market & Option Volatility Report 4-2-19: WBA punched in the face, NDX is strong
Stock Market & Option Volatility Report 4-1-19: April Fools on shorts
Trade Idea of the Week 3-29-19: WTW
Stock Market & Option Volatility Report: 3-29-2019 Will WTW gain weight?
Do I trade a call or a call spread?
The age-old question of when to trade a call or a call spread probably came about right after Sage invented the reversal. The question of when to trade a call or call spread is really about expectations. One of my favorite self-invented maxims is “Make the trade fit the outlook.” Since both have a long delta flavor let’s pull them apart and dissect the two basic option trades.
Call spreads cost less money but do they make enough money?
I use call spreads when I want to save money. The reality is call spread performance is not that great even thought the basic options charts says you get all the money at expiration. And that is true. However as time progresses the risk in the call spread starts to increase since there are more and more dollars in the trade versus what the trade can make. Keeping a long $5 call spread on to catch the last .50 might take a week from expiration and still need the pin. Remember a call spread is the short put spread and those ATM put spreads will hold value until the very last moment.
Calls are for a go-go long position
Long calls are for a rip up in the stock or index over a period. Sort term, mid-term whatever term calls are the choice for massive upside. Riding a long call is important too. Using a stop routine or hedging with a put helps because the whole idea is to stay in for the rip. Having a call go to zero on an unexpected overnight drop is not Bueno. Usually I try to manage some of the long premium risk.
Time to expiration helps
Shorter term trades calls are better than call spreads. If something pops the call spread can get underwhelming performance and time running out is a factor short term. Long term trades can work well with call spreads since the strikes are set nice and wide with the trade much less exposed to a move in volatility. With a long term spread there is the option of closing the short call on a move back.
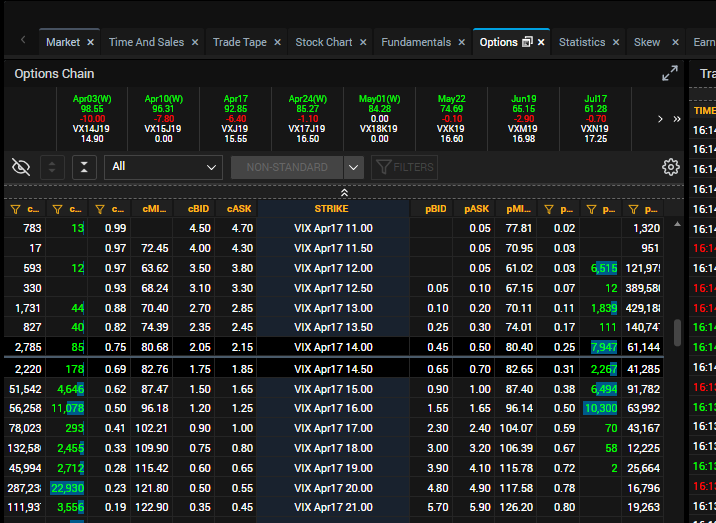
A VIX call trade
VIX call spreads make nice long vol trades since they decay slowly. VIX calls make good blowup hedges against more aggressive SPX iron condors.
IF you want to hear Option Pit live check out the Options Insider Radio Network broadcast.
Disclosure – VIX, SPX positions
Follow Andrew@optionvol
Follow Mark@optionpit
How to Trade VIX
VIX futures constantly discount the VIX cash
From the blog last week we learned VIX is a 30 day forward volatility but the market is moving today. VIX pricing is constantly discounting the daily move to sometime in the future. VIX futures actually try to guess the price of VIX at expiration. VIX is the price now for 30 day volatility and the VIX futures are the price at expiration. That means the VIX futures can swing wildly around the VIX cash price. Usually it swings with in a range based on the time to expiration.

VIX underpriced last week’s move
When I teach volatility I liken it to Newtonian Physics; a body in motion stays in motion. VIX is a lot like that. Last week we had a 2% SPX move but only small pop to a 17 VIX. That is not a lot considering a 2% daily SPX move is closer to a 32% volatility. The 30 day VIX discounted a big part of that move. Almost like VIX DID NOT BUY the selloff.
VIX futures do not stay flat for long
Note the Vix curves I posted. The red is yesterday’s VIX close and the green line is today’s close. VIX futures moved only fractionally and VIX cash had a near $2 range from the highs yesterday to the closing low today. the VIX futures curve was very flat yesterday. That usually signals an unsure volatility market. It does not stay that way for long since VIX keeps rising as the selloff becomes real or the all clear bell is rung. As of today’s close we are close to a fair contango number and the all clear sign albeit at higher VIX.
A VIX Trade
Contango erodes the vol products like VXXB and the current move higher in VIX means more potential downside as future premiums subside. I like VXXB to go lower. Hedging the VXXB premium is relatively inexpensive.
Disclosure: VIX, VXXB positions
Follow Andrew@optionvol
Follow Mark@optionpit
Stock Market & Option Volatility Report: 3-27-19 Swishy VIX but tough to short
Stock Market & Option Volatility Report: 3-26-19 SPX to 2850?
Stock Market & Option Volatility Report: 3-25-19 VIX seems cheap
Trade Idea of the Week: BA
Stock Market & Option Volatility Report 3-22-19: Stock Market does not like German NIRP
The Stock Market Rally No One Saw Coming
Stocks were nonplussed by the FOMC notes yesterday
The stock market rally was a massive surprise. I know pundits will pop on TV next week and say that they have been long all the whole rally and got in big yesterday when the Fed went back to throwing hanging curve balls to the stock market. Maybe Powell and DJT are playing golf at Mar a Lago now. 6 month flat interest rate looks by the Fed are catnip to stocks. Conspiracy theories aside, SPX had yet another face ripping rally and the shorts are wondering what truck just ran them over. The truck was driven by the Fed and tech, MU and AAPL specifically.
The SPX could rally with some volatility for quite a while
Yes VIX was down today. Yesterday we saw fits and starts of volatility but nothing really took hold. Stocks dropped quite a bit but VIX did nothing so it was easy to discount the move. We added more vol leverage to the Option Pit Vol Newsletter yesterday and added a bit more today. Today we got the grind higher with a lower VIX just like it is supposed to. However the .28 VIX drop was pretty light. The reason being ATM IV actually went up in SPX. This is eerily reminiscent of Jan 2018 when SPX and NDX went hyperbolic and the only thing anyone could do was buy calls and hold their breath. If the same action is afoot, there is a trade shape for that.
AAPL and MU jump started a rally on higher volatility
AAPL is going to $200. Mark has been riding call flies in the Option Pit Live chat room and they are getting up to the strike in a hurry. MU rallied $3.85 on the news that earnings were not awful, maybe showing the bottom of the chip cycle. AAPL is $40 from highs and MU $30 so there is plenty of lift left. SOX made a 52 week high today. These go-go moves tend to keep SPX volatility stable as the upside move gets relatively large. I prefer not to get in the way.
The Trade
I like bullish index calendars into the steady vol but do expect vol to dissipate over time. Hedge with junk puts in case since we have the exact same problems, and none of them are solved save the pace of interest rate hikes. Rates holding steady could just be enough.
Disclosure: positons in VIX, SPY, SPX, AAPL, MU
Follow Andrew@optionvol
Follow Mark@optionpit
Stock Market & Option Volatility Report 3-21-19: MU to the moon, BIIB not
Why Do Short Calls Get Assigned?
Short Calls get assigned mostly for two reasons
So why do short calls get assigned? The more I pop into large group chat discussion the more I see this come up. There are several group discussions on FB and StockTwits about options but I largely hang back from them. I figure if you want to know what I have to say you will check out the Option Pit blog or grab one of the free YouTube videos on the Option Pit channel or join Option Pit. I do find the questions interesting because there is an enormous amount of misinformation about options floating around. I will do my best to dispel some of those myths on the 2 big reasons for assignment.
The first reason for assignment is a dividend
The first reason short calls get assigned is for a dividend. Short calls get assigned on the day prior to the ex-div date. A reason why someone would wait until the day before is that every exercise by the holder of the call creates a short synthetic put. No one would want to sell a put earlier than they had too since that would make no sense. The magic formula if a call option would be assigned is if the put value on the same strike is less than the expected dividend. If that happens, it is a 99.9% chance of assignment. If not assigned then it is a mistake by the liquidity provider and some poor clerk gets fired.
ITM calls get assigned in a hard to borrow stock all the time
The second most common form of assignment is in a hard to borrow stock. Since the ability to short the stock is reduced, selling an ITM call option is the next best thing. A liquidity provider might have to pay a negative cost of carry just to hold a short stock position. Since the market on balance wants to short the stock, the value of the ITM call gets reduced relative to the underlying stock price. Moreover, a liquidity provider might have to exercise all their long calls to come into compliance with REG SHO. That means the short call seller gets assigned. The math here is similar to the dividend above but in this case the negative cost of carry greater than the put value will generate a potential assignment. This is harder to figure out since the negative cost of carry can vary from house to house. Most retail customers get in trouble here when the OTM call they sell becomes ITM and then gets assigned. Good morning margin call!
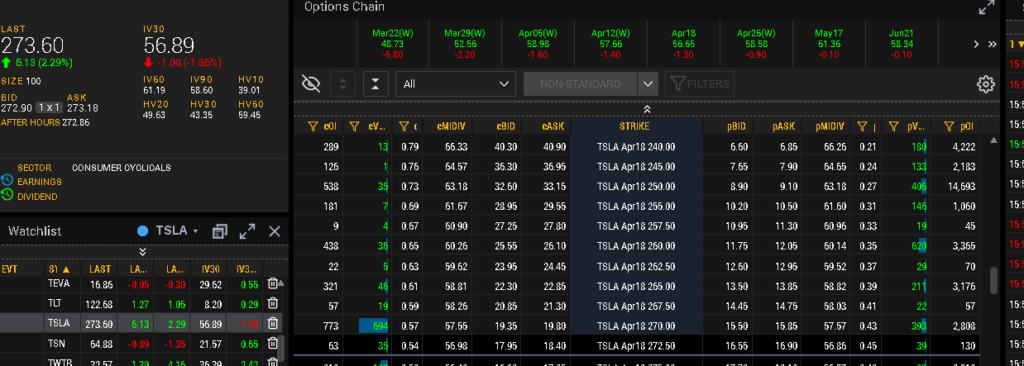
A word about TSLA
TSLA has been in and out of negative cost of carry over the years. Right now the stock is making some new recent lows as the shorts pile in. Be careful of selling ITM calls in TSLA calls because as the borrow rate increases, these could be exercise candidates. Very wide, long put butterflies seem to work decently for a short and has near 0 assignment risk.
Follow OptionVol on the Options Insider Radio Network Tomorrow
Follow Andrew@optionpit
Follow Mark@optionvol
When to Buy a Call or Sell a Put
How long does one want to be?
When to buy a call or sell a put? This should be a straight forward question but ask any two option traders and there will be two different answers. My answer, a small cop-out, is it depends on what is going on. The reality is buying a call or selling a put depends on how LONG ONE WANTS TO BE. There is actually a pretty good distinction between the two.
Trade for plan, hedge for wrong
The first assumption is we want the stock to go up. Rocket science you say and I say not so fast. Take BA right now for example. I expect BA will be back above $400 in a month or two. I don’t expect that to happen this week or next although it might. If your position is long delta there are no worries if it rallies so I take the expected result off the table. When choosing the type of trade idea I assume my opinion is right but hedge in case I am wrong.
-
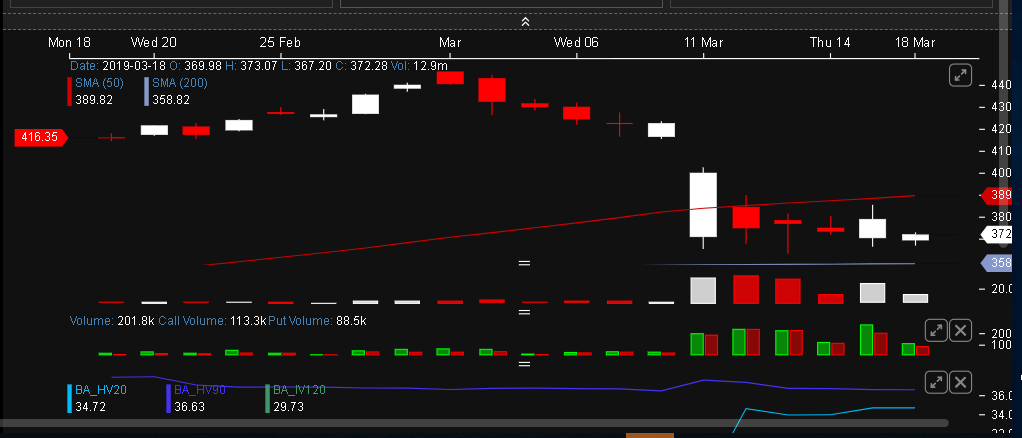
Chart from Cboe Livevol Pro
What does the put sale yield?
BA is exhibiting a more orbiting type of move after the first rash of bad news. It could get worse and the stock market could decide to take the entire growth premium out of BA and send the stock back to $300 as in December. If I sold a put I would do so there, at the yucky spot with the Jun 300 yielding 1% on a cash secured put. That is hardly enough to get the blood pumping but a nice place to buy some stock.
Is there enough lift for a call?
BA at $400 does not look too bad but any resolution before May seems difficult. The BA May17 400 calls are $8. The decay on that call is enough to melt the Wicked Witch of the West in The Wizard of Oz. The only things keeping that option from dying are earnings and the current maelstrom BA finds itself in. With BA nearer the bottom of the current range there could be enough lift in another $10 move but now that the government is investigating “the pop” might take a while.
To orbit or pop
The decision is the “the orbit” with the short put or the “the pop” with a long call. Short term the orbit in BA seems more likely with a pop out in time once the resolution becomes clear. I like the short put or put spread on the orbit, and calls only when the upside is really worth it once the put trade proves correct.
Catch Option Pit on the Options Insider here
Follow Andrew@optionvol
Follow Mark@optionpit
Stock Market & Option Volatility Report 3-20-19: FDX causing a FED up FED and a higher VIX
Stock Market & Option Volatility Report 3-18-19: Play on VIX expiration
Stock Market & Option Volatility Report 3-15-19: The good & bad of the market
When to Buy a Call or Sell a Put
How long does one want to be?
When to buy a call or sell a put? This should be a straight forward question but ask any two option traders and there will be two different answers. My answer, a small cop-out, is it depends on what is going on. The reality is buying a call or selling a put depends on how LONG ONE WANTS TO BE. There is actually a pretty good distinction between the two.
Trade for plan, hedge for wrong
The first assumption is we want the stock to go up. Rocket science you say and I say not so fast. Take BA right now for example. I expect BA will be back above $400 in a month or two. I don’t expect that to happen this week or next although it might. If your position is long delta there are no worries if it rallies so I take the expected result off the table. When choosing the type of trade idea I assume my opinion is right but hedge in case I am wrong.
-
Chart from Cboe Livevol Pro
What does the put sale yield?
BA is exhibiting a more orbiting type of move after the first rash of bad news. It could get worse and the stock market could decide to take the entire growth premium out of BA and send the stock back to $300 as in December. If I sold a put I would do so there, at the yucky spot with the Jun 300 yielding 1% on a cash secured put. That is hardly enough to get the blood pumping but a nice place to buy some stock.
Is there enough lift for a call?
BA at $400 does not look too bad but any resolution before May seems difficult. The BA May17 400 calls are $8. The decay on that call is enough to melt the Wicked Witch of the West in The Wizard of Oz. The only things keeping that option from dying are earnings and the current maelstrom BA finds itself in. With BA nearer the bottom of the current range there could be enough lift in another $10 move but now that the government is investigating “the pop” might take a while.
To orbit or pop
The decision is the “the orbit” with the short put or the “the pop” with a long call. Short term the orbit in BA seems more likely with a pop out in time once the resolution becomes clear. I like the short put or put spread on the orbit, and calls only when the upside is really worth it once the put trade proves correct.
Catch Option Pit on the Options Insider here
Follow Andrew@optionvol
Follow Mark@optionpit
Stock Market & Option Volatility Report 3-13-19: VIX is at a six month low
Stock Market & Option Volatility Report 3-12-19: AAPL pop, BA drop
Stock Market & Option Volatility Report 3-11-19: Face ripper in SPX and VIX crush
Stock Market & Option Volatility Report 3-8-19: VIX and VVIX are screaming
Stock Market & Option Volatility Report 3-7-19: VIX higher and Market lower but reasons unclear
Stock Market & Option Volatility Report 3-6-19: Another slow market? Why is VIX climbing?
Stock Market & Option Volatility Report 3-5-19: Will the VIX pop or drop?
Stock Market & Option Volatility Report 3-4-19: Trade deal!
Stock Market & Option Volatility Report 3-1-19: Market moving higher, VIX to 13
Stock Market & Option Volatility Report 2-28-19: Stocks are going nowhere
Stock Market & Option Volatility Report 2-27-19: Third day of strong VIX
Stock Market & Option Volatility Report 2-26-19: VIX crazy action last two days
Stock Market & Option Volatility Report 2-25-19: VIX will have a tough time dropping
Trade Idea of the Week 02.22.2019: SPY
Stock Market & Option Volatility Report: 02.22.2019
Stock Market & Option Volatility Report: 02.21.2019 Fading a NKE fade
Stock Market and Option Volatility Report: 02.20.2019 IYT sunk by airlines, DVN a bottom for oil?
Stock Market and Option Volatility Report: 02.19.2019 VIX another sub 15 day, SPX more strength
Stock Market and Option Volatility Report: 02.15.2019 SPX off to the races
Stock Market and Option Volatility Report: 02.14.2019 We think the Stock Market is going to rally today
Stock Market and Option Volatility Report: 02.13.2019 VIX is bid with SPX up
Stock Market and Option Volatility Report: 02.12.2019
Stock Market and Option Volatility Report: 02.11.2019
Stock Market and Option Volatility Report: 02.08.2019 SPX is off VIX says MEH
Stock Market and Option Volatility Report: 02.07.2019 World’s shortest sell off in SPX
Stock Market and Option Volatility Report: 02.06.2019 Market down, vol down
Stock Market and Option Volatility Report: 02.05.2019
Stock Market and Option Volatility Report: 02.04.2019
Stock Market and Option Volatility Report: 02.01.2019
Stock Market and Option Volatility Report: 1-30-19
Stock Market and Option Volatility Report: 1-29-19
Stock Market and Option Volatility Report: 1-28-19
Trade Idea of the Week: SPY
Stock Market and Option Volatility Report: 1-25-19
Stock Market and Option Volatility Report: 1-24-19
Stock Market and Option Volatility Report: 1-23-19
Stock Market and Option Volatility Report: 1-22-19
Stock Market and Option Volatility Report: 1-17-19
Stock Market and Option Volatility Report: 1-16-19
Stock Market and Option Volatility Report: 1-15-19
Stock Market and Option Volatility Report: 1-14-19
Stock Market and Option Volatility Report: 1-10-19
Stock Market and Option Volatility Report: 1-8-19
Stock Market and Option Volatility Report: 1-7-19
Trade Idea of the Week: VXX strangles
Morning Vol Report: Will they decay the 4 day holiday out?
Morning Vol Report: SPX IV is not going down
Morning Vol Report: $9 backwards for VIX, CRAZYTOWN
Morning Vol Report: VVIX not showing panic yet 12.24.2018
Idea of the Week AAPL Leaps 12.21.2018
Stock Market Volatility Report 12-20-2018: Is today the day volatility moves?
Stock Market Volatility Report 12-19-2018: Markets await FOMC
Stock Market Volatility Report 12-18-2018:
Stock Market Volatility Report 12-17-2018: More ugly with little VIX
Stock Market Volatility Report 12-14-2018:
Stock Market Volatility Report 12-13-2018: Will SPX see 2700 after FOMC?
Stock Market Volatility Report 12-12-2018:
Stock Market Volatility Report 12-11-2018: AAPL is the key
Stock Market Volatility Report 12-10-2018: SPX at pivot point, VIX still meh
Stock Market Volatility Report 12-7-2018: Market Steady after jobs number
Stock Market Volatility Report 12-6-2018: SPX & DOW leading NDX and RUT lower VIX lagging
Stock Market Volatility Report 12-4-2018:
Stock Market Volatility Report 12-3-2018:
Stock Market Volatility Report 11-30-2018:
Stock Market Volatility Report 11-29-2018: VIX is Bid
Stock Market Volatility Report 11-28-2018: Powell speech effecting VIX futures
Stock Market Volatility Report 11-27-2018: $SPX up and what about $AAPL?
Stock Market Volatility Report 11-23-2018: Rally Ho for SPX?
Stock Market Volatility Report 11-21-2018: SPX appears to be a pump fake
Stock Market Volatility Report 11-20-2018: NDX revaluing
Stock Market Volatility Report 11-19-2018: The great VIX and VXN divide
Stock Market Volatility Report 11-15-2018: SPX setting up for a bottom and VIX a top
Stock Market Volatility Report 11-14-2018: Nat Gas flying higher, AAPL IV crazy
Stock Market Volatility Report 11-13-2018 Will the SPX bounce hold?
Stock Market Volatility Report 11-12-2018 QQQ down big and it could keep going
Stock Market Volatility Report 11-09-18: SPX finding the 200 day moving average
Stock Market Volatility Report 11-08-18: Stock Market pullback no surprise
Stock Market Volatility Report 11-07-18: Elections are over!
Stock Market Volatility Report 11-06-18: Stock Market making run at 200 day moving average
Stock Market Volatility Report 11-05-18: Stock Market finding a floor?
Stock Market Volatility Report 11-02-18: Ignore APPL?
Stock Market Volatility Report 11-01-18: Remember, watch the RUT
